I have studied “economic growth” in my MSc thesis at the University of Essex in 2014. You can reach it from here. Nowadays, I am planning to publish an article regarding the similar topic.
In line with this purpose, in this text, I would like to handle some analysis related to the topic in more detail.
In his seminal work “Technical Change and the Aggregate Production Function”, Solow ( 1957) studies, ‘to what a certain extent technical change differs from capital stock in explaining output per worker rises’. Solow analyzes this quest by using a mathematical specification that was then named as “Solow production function”:
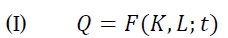
Where, the variables t is for time, Q is output, K is capital, L is labor. Here t in F allows for technical change which enables “any kind of shift in the production function”. If neutral technological changes are assumed (I) can be written as (II);
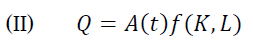
Where the total influence of shifts in production function is measured by A(t). If we differentiate (II) w.r.t. time and divide it by Q, we end up with (III);
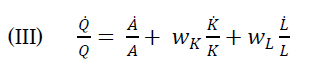
Where, is relative share of capital and
 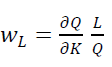 is relative share of labor. And dots reflect the time derivatives.
Using (III) A(t) is obtainable. (Constant returns to scale is assumed)
Take Q/L = q and K/L = k (III) can be written as (IV);
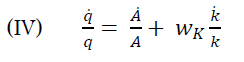
Using IV, Solow (1957) disentangle  using the series demonstrated at its “Table-1”:
Table 1- Solow’s (1957) Table I.
The above table consists these series:
- (1): Percentage of labor force employed
- (2): Capital stock in USD millions.
- (3): Multiplication of (1) and (2) ended up with (3) which is total capital stock attributed to total labor force,
- (4): Share of property in income,
- (5): Private nonfarm GNP per worker hour,
- (6): Employed capital per worker hour = (3) / (total man hour series obtained from Kendrick’s data, not demonstrated at the table)
- (7):
 change in (5) – (4) * change in (6)
 - (8): (8) is calculated using (7)
This means 
I replicated this practice as follows:
Table 2- Replication of Solow’s (1957) Table I.
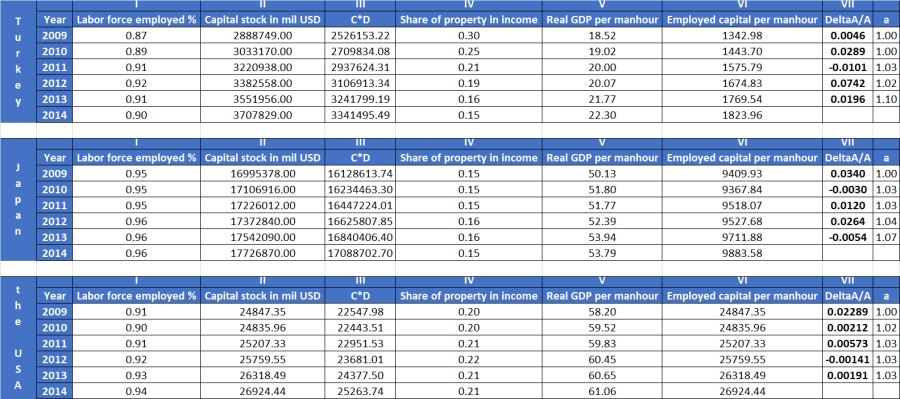
- (I): Labor force employed as percentages calculated Worldbank dataset (1-unemployment rate),
- (II): Capital stock at constant 2011 national prices (in 2011 USD mil.) from PWT 9.0 data files (rkna),
- (III): (I) X (II),
- (IV): Property income, payable obtained from OECD – “Government deficit/surplus, revenue, expenditure and main aggregates” dataset by dividing total output to property income payable.
- (V): GDP per person employed (constant 2010 USD millions) from Worldbank divided by average annual hours actually worked per worker from OECD (Unfortunately, I was not able to use GNP series, instead I have used GDP.)
- (VI): (III) divided by average annual hours actually worked per worker from OECD (Does not present at the Table 2).
- (VII): change in (V) – (IV) * change in (VI).
Using above mentioned calculations I have created Figure-1.
Figure 1- TFP growth for Japan, Turkey and the USA over 2009-2013
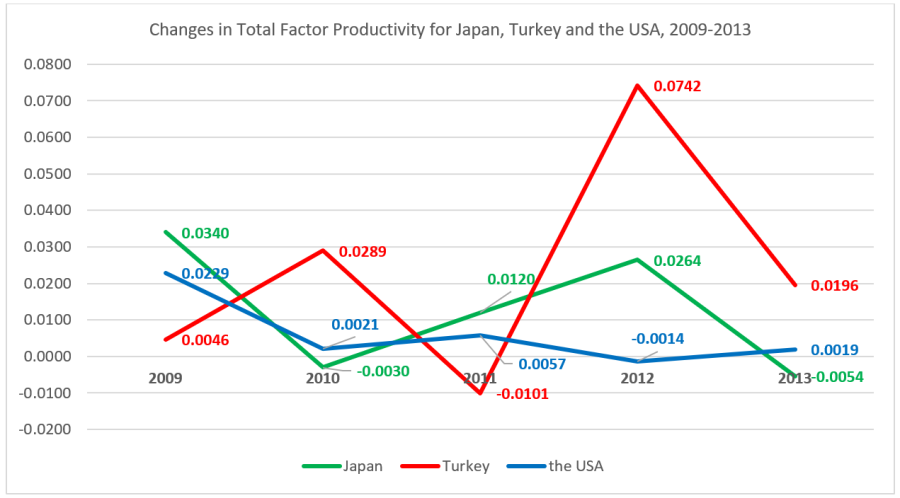
According to the Figure 1, TFP growth in Turkey was more volatile than TFP growth in Japan and in the USA. In 2009, Turkey’s TFP growth reached a peak in 2012 at 0.0742.
Over 2009-2013, the largest TFP growth Japan accomplished was in 2009 at 0.00340. Following this highest level, Japan had negative value in 2010 at -0.0030. After 2010, Japan had positive rates consecutively in 2011 at 0.0120 and in 2012 at 0.0264.
The USA growth rates of the USA have remained positive for four years over 2009-2013. The only shrinking was in 2012 at -0.0014.
References:
Burkhead, J. (1953). Changes in the functional distribution of income. Journal of the American Statistical Association, 48(262), 192-219.
Kendrick, J. W. (1961). Productivity trends in the United States. Productivity trends in the United States.
Solow, R. M. (1957). Technical change and the aggregate production function. The review of Economics and Statistics, 312-320.
Data sources:
https://databank.worldbank.org/indicator/NY.GDP.MKTP.KD.ZG/1ff4a498/Popular-Indicators#, 25 Jun 2019.
https://data.worldbank.org/indicator/SL.UEM.TOTL.ZS, 26 Jun 2019.
https://www.rug.nl/ggdc/productivity/pwt/pwt-releases/pwt9.0, 25 Jun 2019.
https://stats.oecd.org/Index.aspx?DataSetCode=SNA_TABLE12#, 25 Jun 2019.
