The second approach for measuring GDP is using aggregating all the expenditures in a given year in an economy.
[
GDP = C + I + G + XN
I = If + Is
GDP = C + If + Is + G + XN
]
C = Consumption
I = Gross investment
If = Fixed investment
Is = Stock investment
G = Government purchases
XN = Net exports
Currently, there are two data tables related to the total spending approach at the TUIK (Turkish Statistical Institute) web site. (see http://www.turkstat.gov.tr/UstMenu.do?metod=temelist follow: National Accounts -> Gross Domestic Product by Expenditure Approach (2009 Base))
1.Gross domestic product in chain linked volume, index and percentage change by expenditure approach,1998-2017.
The first data table under spending approach contains the statistics in six different items:
- Resident households and non-profit institutions serving households final consumption expenditure
- Government final consumption expenditure
- Gross fixed capital formation
- Change in stocks
- Exports of goods and services
- Imports of goods and services
together with Nominal gross domestic product values, over 1998-2017.
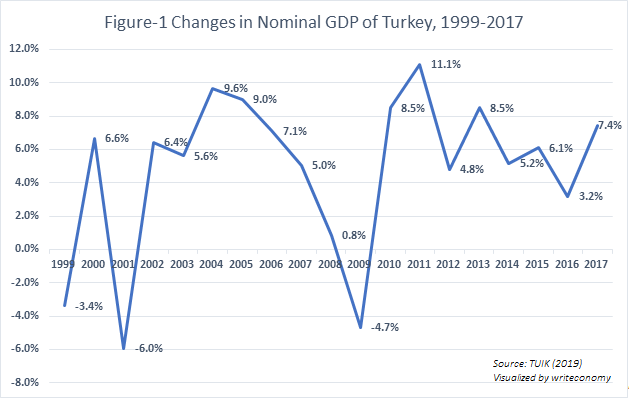
I have created a figure using the GDP changes as follow (Figure-1). There were two drastic declines in nominal GDP, the first was in 2001 at -%6 and the second was in 2009 at -%4.7. The largest positive change was experienced in 2011 at %11.1.
2.Gross domestic product at current prices by expenditure approach (value, share, percentage change), 1998-2017.
The second data table in spending approach details the items in the first data table creating their share in nominal GDP and their percentage changes.
It seems, considering “GDP = C + If + Is + G + XN“ equation the classification is made as follows:
- item A equals to Consumption (C),
- item B represents Government spending (G),
- item C is for Fixed Investment (If)
- item D represents Stock investment (Is)
- items E&F together equal to Net export (XN)
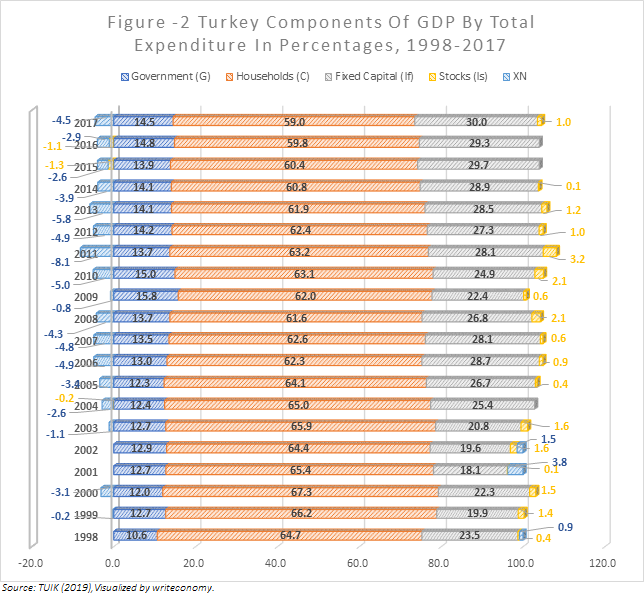
All the five items in Figure -2 constitutes the GDP and equal to % 100. The share of consumption (C) has decreased over time, it was % 64.7 in 1998 and % 59 in 2017. On the contrary, the share of government spending (G) increased from %10.6 in 1998 to %14.5 in 2017. Fixed capital value fluctuated in the range of % 18.1 (2001) to % 30 (2017).
The share of net export remained negative most of the years, while having its largest values in 2011 at % 8.1, in 2013 at -% 5.8 and in 2010 at -%5.0. The share of stocks has been positive except three years.

To better analyze the foreign trade, I have created Figure-3, which shows GDP shares of export, import and net export over 1998-2017.
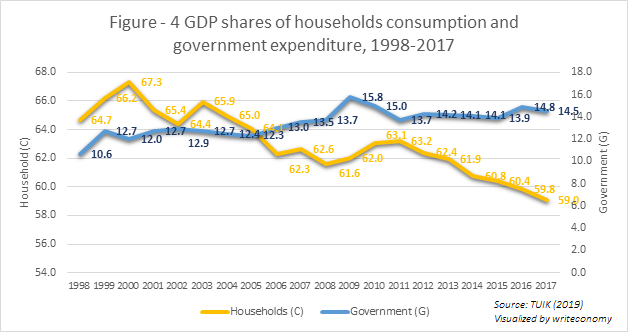
Lastly, Figure-4 shows the trends of household consumption and government spending over 1998-2017. A clear down trend in household consumption is easily identifiable. The difference between G and C have been gradually increasing.
