There are three methods for measuring GDP. These are using:
- Total production,
- Total spending,
- Total income.
In this article, I will deal with the total production method.
In this method, GDP is assumed to be equal to the summation of all the value added created by all firms in an economy.
[GDP = Aggregate of value added created by all firms in an economy]
This method is good for investigating all the sectors of an economy, as it gives the breakdown of economic activities.
Currently, there are three data tables related to the production approach at the TUIK (Turkish Statistical Institute) web site. (see: http://www.turkstat.gov.tr/UstMenu.do?metod=temelist follow: National Accounts -> Gross Domestic Product by Production Approach)
1. Gross Domestic Product Per Capita, 1998-2018
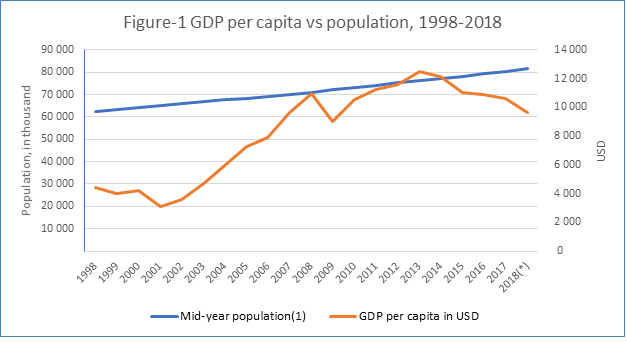
According to the information provided by “Gross domestic product per capita, 1998-2018” data table, population of Tukey increased from 62.5 million in 1998 to 81.4 million in 2018, like this, GDP per capita went up from 4,442 USD to 9,632 USD over the same duration (Figure-1) .
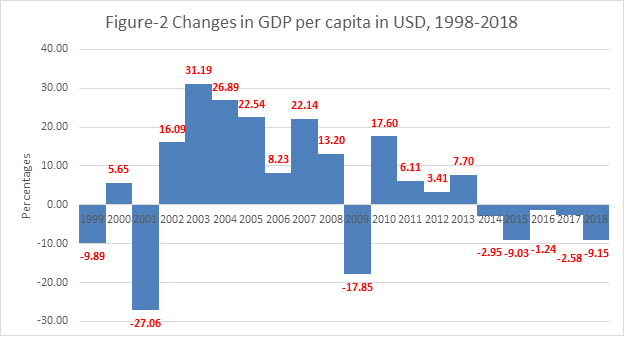
The changes in GDP per capita in USD terms is demonstrated in Figure-2. The largest negative change was experienced in 2001 at % -27.06 while the positive change was realized in 2003 at % 31.19.
2. Gross domestic product at current prices by kind of economic activity (A21) (value, share, percentage change), at current prices, 1998-2017
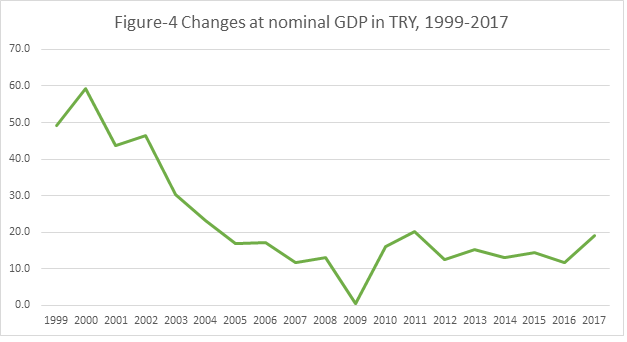
According to the information provided by “Gross domestic product at current prices by kind of economic activity (A21) (value, share, percentage change), at current prices, 1998-2017” data table, nominal GDP was 71.9 billion TRY in 1998 and 3,106.5 billion TRY in 2017 (Figure-3).
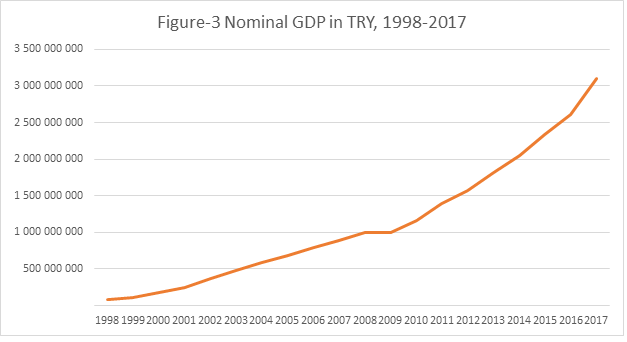
Figure-4 demonstrates the percentage changes in nominal GDP over 1999-2017.
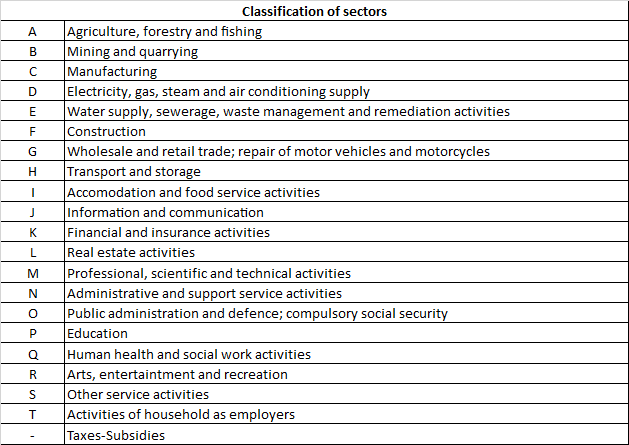
The data table breaks down the economy into 20 sectors (see Notes). The leading sectors have been Industry (B-mining and quarrying; C-manufacturing; D-electricity, gas, steam and air conditioning supply), G-trade and H-transport. They have average shares of % 19.5, % 11.8 and % 11.8 respectively. They are followed by A-Agriculture, forestry and fishing (% 8.5), L-Real estate activities (% 8.3) and F-Construction (% 6.5) (Figure-5).
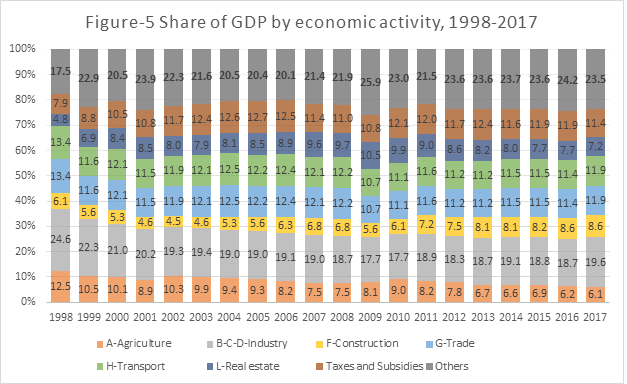
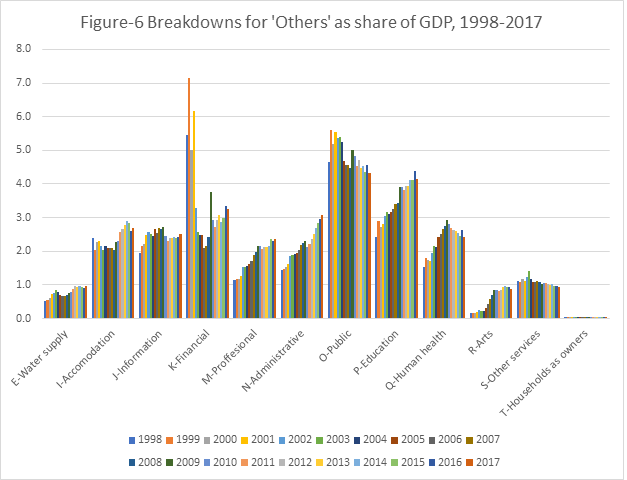
To better understand the share of economic activity represented by ‘others’ in Figure-6, I have created In Figure-5.
3. Gross domestic product in chain linked volume, index and percentage change [2009=100], by kind of economic activity (A21), 1998-2017
The data table under this title gives the indexes of sectors’ production volumes while taking 2009 as base year and provides percentage changes of the production using volumes.
Figure – 7 demonstrates the indexed value of three sectors under “Industry”. B- Mining has been stable in the range of 90 and 130. However, C-Manufacturing and D-Electricity had a increasing trend, starting from about 70 in 1998 and to approximately 190 in 2017.
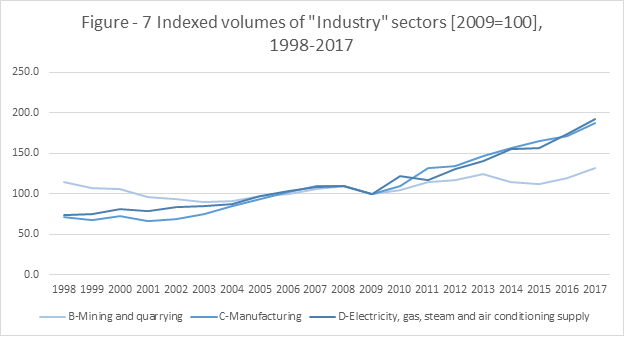
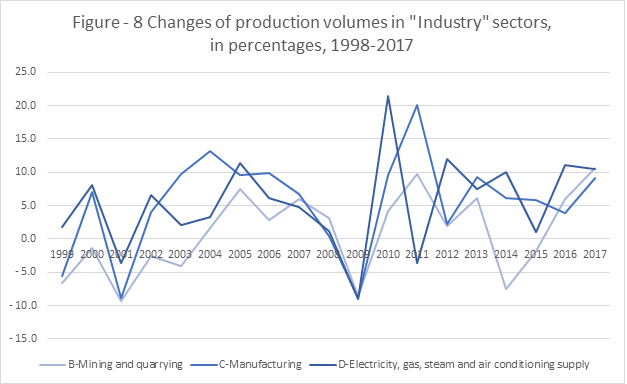
Figure-8 illustrates the percentage changes in production of sectors under “Industry”. The production in C-Manufacturing sector had its largest increase in 2011 at % 20, while having its largest decrease at % – 8.9 in 2001 and in 2009. The changes of D-Electricity sector production had a % 21.4 increase in 2010 and a % – 9 decrease in 2009. The volatility in the production of B-Mining sector remained more stable in the spread of % -9.4 and % 10.7.
The Figure – 9 shows the trends in production volumes of four leading sectors (A-Agriculture, F-Construction, G-Trade and L-Real estate activities) over 1998-2017 as an index. F-Construction sector experienced the largest raise from 1998 at 58.9 to 2017 at 228.2 among other three sectors. G-Trade sector showed a similar path like construction sector. It had the value of 82.9 in 1998 and 191.5 in 2017. A-Agriculture and L-Real estate activities had a slightly increasing up-trend starting roughly at 83 in 1998 and reaching approximately at 130 in 2017.
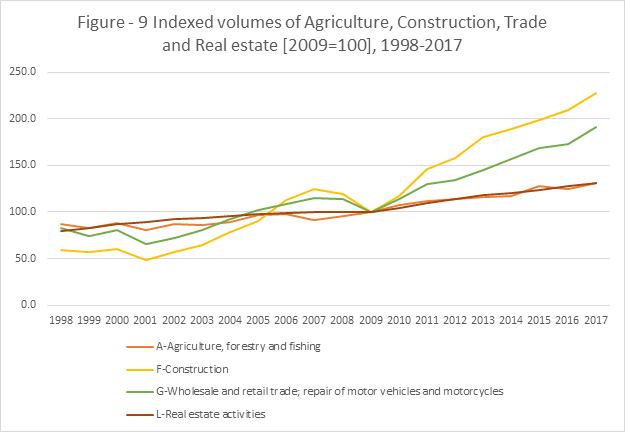
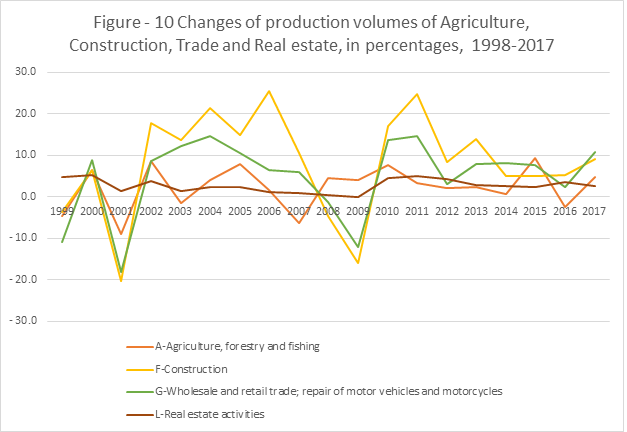
Figure – 10 gives information regarding the percentage changes in production of A-Agriculture, F-Construction, G-Trade and L-Real estate sectors over 1998-2017. L-Real estate activities had less changes having an average value of % 2.7 considering 19 years. F-Construction sector had larger increases than % 20 in 2004, in 2006 and in 2011. Increases in A-Agriculture sector did not exceed % 10, the largest increases experienced in 2015 at % 9.4, in 2002 % 8.7 and in 2005 at % 7.9. G-Trade sector has been fragile to the shocks, it dropped in 2001 at -%18 and in 2009 at -%12.
Notes:
Annex: